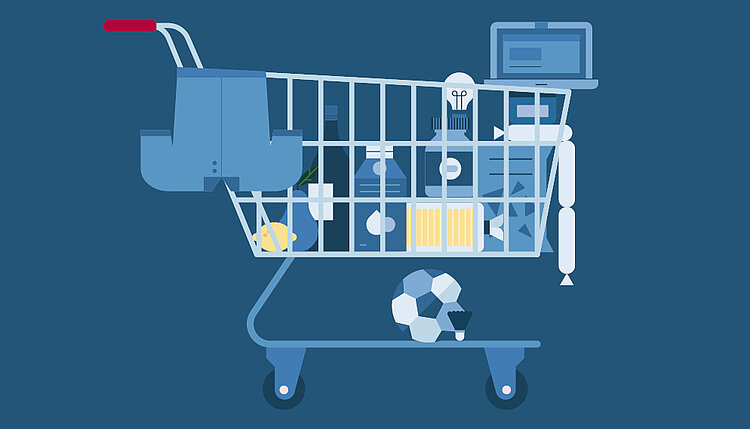
The statistics on high growth enterprises refer to
employer enterprises, which have an average annual increase of the number
of their employees of at least 10% over a three-year-period. In order
not to distort the shares of fast growing enterprises compared to the
overall number of employer enterprises, all enterprises not having at
least 10 employees at the beginning of the observation period (t
The outcome of the statistics is as well used as a basis for the “high growth innovative enterprises” indicator within the Agenda „Europe 2020“. The European Council requested in February 2011 that the Commission should start establishing a new indicator for growth and employment in the framework of Strategy 2020, in order to track changes in the progress of innovation processes. Since reference year 2013, the data collection on high growth enterprises is mandatory on European Level. With this year’s data collection, reference year 2019 is added to the data series.
Results are available for the following periods: 2005 to 2008, 2006 to 2009, 2007 to 2010, 2008 to 2011, 2009 to 2012, 2010 to 2013, 2011 to 2014 and 2012 to 2015, 2013 to 2016, 2014 to 2017, 2015 to 2018 and 2016 to 2019.
2008 | 2009 | 2010 | 2011 | 2012 | 2013 | 2014 | 2015 | 2016 | 2017 | 2018 (prel.) | 2019 (prel.) | |
Number of high growth enterprises (10% growth; 10 employees at the beginning of the growth period) | ||||||||||||
Number of employer enterprises with at least 10 employees | ||||||||||||
Share of high growth enterprises on employer enterprises in percent | 9.1 | 6.5 | 5.8 | 6.4 | 6.9 | 6.8 | 6.9 | 6.6 | 7.3 | 8.0 | 8.2 | 8.4 |
In 2019 the number for employer enterprises with at least 10 employees
The “production sector” (ÖNACE 2008 sections B-F) shows with 7.9% a lower rate than the “services sector” (ÖNACE 2008 section G-S) with 8.6%.
In 2019, high shares of high growth enterprises at the level of ÖNACE 2008 section are in the following branches: “Information and communication” (17.0%), „Administrative and support service activities” (12.7%), “Professional, scientific and technical activities” (11.3%) and „Other service activities” (10.0%). The smallest shares of high growth enterprises can be found in the sections “Financial and insurance activities” (2.8%) and „Electricity, gas, steam and air conditioning supply” (4.2%).
The highest shares of high growth enterprises in 2019 accounting to the legal forms have the limited liability companies with 9.7%. The shares of non-incorporated firms (partnerships and other legal forms) and of sole proprietorships amount to 5.5% and 6.0%.
Amongst the provinces the highest shares of high growth enterprises 2019
are in Vienna (9.8%) as well as in Styria (8.8%), Upper Austria (8.4%)
and Burgenland (8.2%). The smallest share has Vorarlberg with 6.8%.
High growth enterprises with high counts on employees are found 2019 in the sections “Manufacturing”
The average size of high growth enterprises – measured in the number of employees per high growth enterprise – amounts in 2019 to 57.
Since 2015 a revised method to produce statistics on high growth enterprises is used. The data were recalculated with the new method back to reporting year 2008. The data are preliminary for the last two reporting years (here: 2018 and 2019).
The total values in the tables do not include until 2012 group 64.2 of ÖNACE 2008.
Further information on the methodology of the data collection.